The Short Version
This August 2026 snapshot examines 406 selected US and UK B2B SaaS/martech keyword-market rows with Ahrefs volume of at least 500/month. AI Overviews appeared on 83.7% of US rows and 77.0% of UK rows. Among the 388 rows with non-null Ahrefs click-distribution fields, AIO-present rows had a higher modeled residual not assigned to organic-only, paid-only, or mixed clicks: 38.5% in the US and 43.5% in the UK. These are modeled, observational associations - not the number of clicks caused or erased by AI Overviews, and not a claim about B2B SaaS search generally. A separate, purposive 50-pull citation check - skewed toward much higher-volume queries and not randomly selected - found vendor/brand pages were the largest source category within that exploratory subsample (46.9%), with YouTube (20.1%) and Reddit (6.8%) together comparable to the entire third-party-publisher category (23.5%).
This piece is the quantitative companion to CoreAEX's AEO Fundamentals: How to Get Cited, Not Just Ranked - that piece covers why ranking is an increasingly unreliable predictor of AI citation; this one measures what that gap looks like in click-share data, and who wins the citations in a sample where ranking no longer guarantees them.
Methodology, in Brief
What changed in this revision (Aug 26, 2026):
An independent statistical review of the Aug 25 page found the core sample statistics reproduced correctly from the downloadable data, but flagged nine interpretation and disclosure issues: causal-sounding language around a modeled residual, an understated null-data count, a combined-CSV/label mismatch, population-level claims from a selected sample, an overstated volume trend in the UK, a causal decomposition of the US/UK gap, an underdisclosed citation-subsample selection bias, an unsupported Domain-Rating "eligibility gate" claim, and a quarterly-comparability promise without a frozen panel. All nine are corrected below and throughout this piece; nothing in the underlying data changed.
This study combines two keyword-sourcing methods into one Ahrefs-derived dataset, pulled August 25, 2026 for both the US and UK. Domain-mined: top-10-ranking, non-branded keywords (500+ searches/month) pulled from five B2B-SaaS-adjacent authorities - G2, Capterra, HubSpot, Zapier, and SaaStr - filtered against a roughly 90-term B2B SaaS/martech vocabulary list. SaaStr returned no UK rows meeting this study's combined top-10, volume, non-brand, and relevance filters - that shows something about this study's filters, not necessarily about SaaStr's overall content footprint or indexing. Curated seed list: the identical roughly 190-query hand-authored list, spanning informational, commercial, transactional, and branded intent, pulled once per market so market comparisons aren't confounded by different queries. Neither sourcing method, nor the combination, is a random or exhaustive sample of "all B2B SaaS search demand" - see Limitations.
Sample sizes and valid n. The combined download contains 435 collected keyword-market rows (269 US, 166 UK); 406 of those (258 US, 148 UK) meet the stated 500/mo volume floor and form the AI-Overview-presence sample discussed in Finding 1. A further 10 US and 8 UK rows in that 406 have null values in all three of Ahrefs' click-distribution fields (organic-only, paid-only, organic-and-paid), so the click-distribution analysis in Finding 2 onward uses a narrower 388-row sample (248 US, 140 UK) - 209 US and 106 UK AIO-present rows, 39 US and 34 UK AIO-absent rows. Every chart and stat below states its own valid n; where a figure doesn't, it's drawn from the 406-row presence sample.
The downloadable data now matches this description: the combined CSV carries an included_in_analysis flag distinguishing the 406 analysis rows from the 435 collected rows. Note on this revision: a separately downloadable, pre-filtered 406-row analysis file is planned but not yet attached to this update - the four CSVs below are unchanged from the original release pending that addition.
A matched-pair sub-analysis isolates the 109 keywords that returned usable data in both markets - a useful like-for-like comparison, though it is itself a selected subset rather than the full sample with one variable removed (see Finding 6). A separate citation-source check pulled SERP Overview at the ai_overview / ai_overview_sitelink position types for 50 query pulls (35 US, 15 UK), yielding 294 citations across 106 unique domains; see "Expanded check" below for why this is an exploratory subsample, not a representative cut of the full sample.
"Modeled residual" (called "implied no-click share" in the underlying data) is calculated as 100% minus the sum of Ahrefs' three reported click-distribution figures for a keyword (organic-only, paid-only, and organic-and-paid click share). It is a derived figure Ahrefs' model does not assign to any of the three click types - not a direct measure of clicks an AI Overview removed, and not raw Google data. See Limitations for what it can and cannot support.
This is a single cross-sectional snapshot dated August 25, 2026 - an observational description of one point in time, not a trend, not a randomized experiment, and not yet a time series. Where this piece uses words like "higher," "lower," or "tracks," it means an association observed in this sample, not a causal claim.
Finding 1: AI Overviews Dominate This Selected Sample
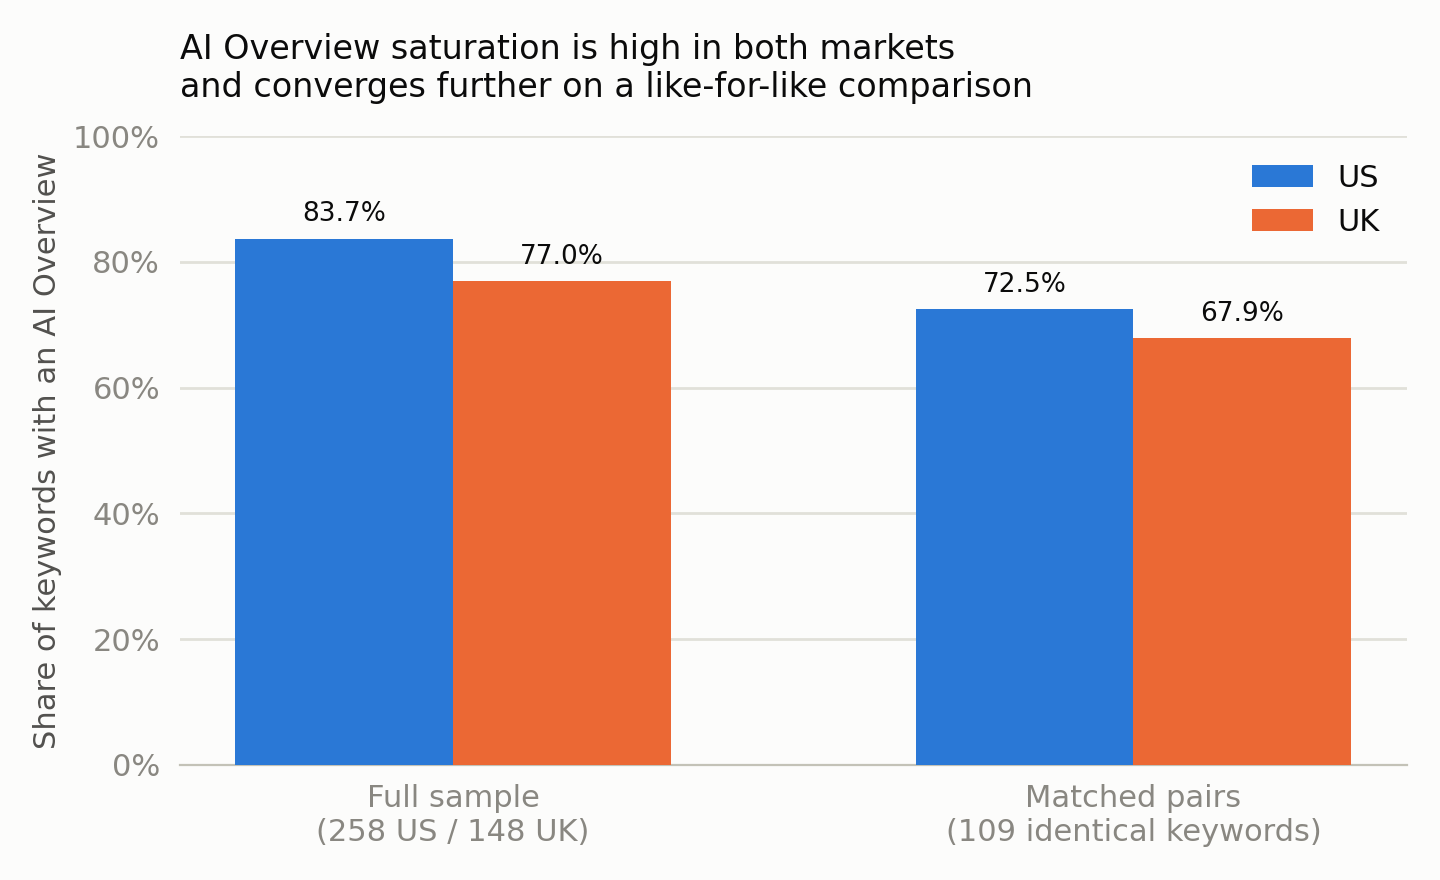
Of the 258 US keyword-market rows in this sample (Ahrefs volume 500+/mo), 216 (83.7%) show an AI Overview in their SERP; 42 (16.3%) do not. The UK shows the same pattern at a somewhat lower rate: 114 of 148 (77.0%). This wasn't the original research design - the study set out to compare AI-Overview-present vs. absent rows head to head, but an early pull found the absent comparison group too thin at meaningful search volumes to support that comparison on its own, in either market. Within this selected B2B SaaS/martech sample - a mix of five domain-mined content authorities and a hand-authored keyword list, filtered to top-10 rankings, non-brand intent, and a relevance vocabulary - "does this query trigger an AI Overview" is close to a moot question in both markets. That's a description of this sample, not a census of all B2B SaaS search demand: the sourcing methods (see Limitations) mean this saturation rate shouldn't be read as "X% of decently-trafficked B2B SaaS searches" in general. The more useful question the data can speak to is how much organic click share survives, on average, when the AI Overview is already there - covered next.
Finding 2: Where the Clicks Actually Go
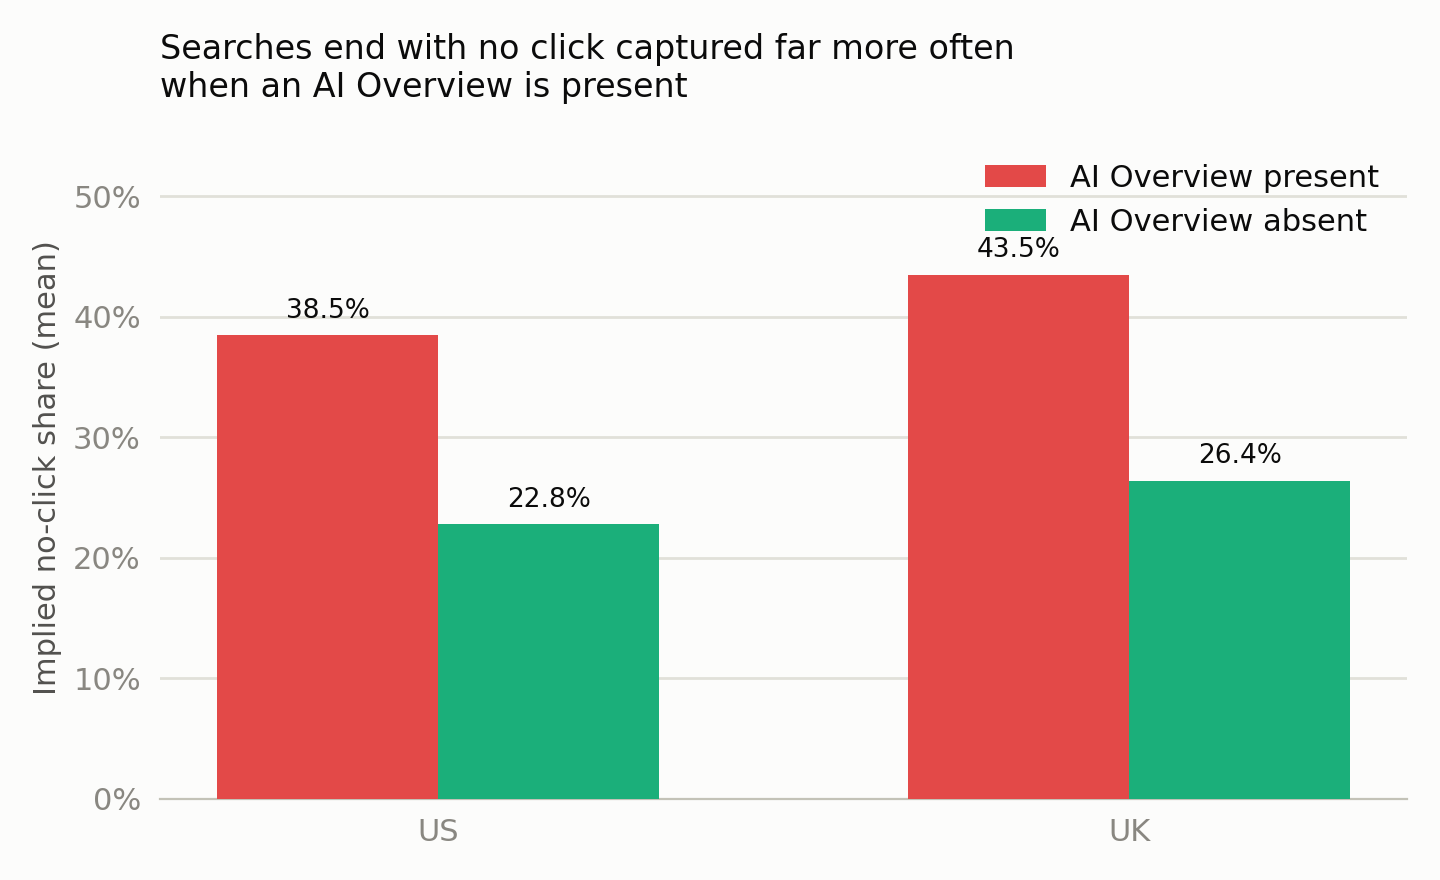
Among rows with non-null Ahrefs click-distribution data, mean organic-only click share is lower on AIO-present rows than on AIO-absent rows in both markets: 51.3% vs. 61.6% in the US (209 present rows vs. 39 absent), and 47.7% vs. 57.9% in the UK (106 present vs. 34 absent). The modeled residual is correspondingly higher on AIO-present rows: 38.5% vs. 22.8% in the US, 43.5% vs. 26.4% in the UK. This is an observational association, not a causal estimate: AI Overview presence was not randomly assigned, and the roughly 15-17 point present-vs-absent gap could partly reflect that AI Overviews and lower organic click share both correlate with how "answerable" Google judges a query to be, independent of any effect of the AI Overview itself. Paid-only click share is also lower on AIO-present rows in the US (6.0% vs. 13.4%) - plausibly because generic, high-competition queries with heavy paid presence are also the ones most likely to already carry an AI Overview, not because the AI Overview displaces paid clicks.
Finding 3: The Residual Tracks Query Intent
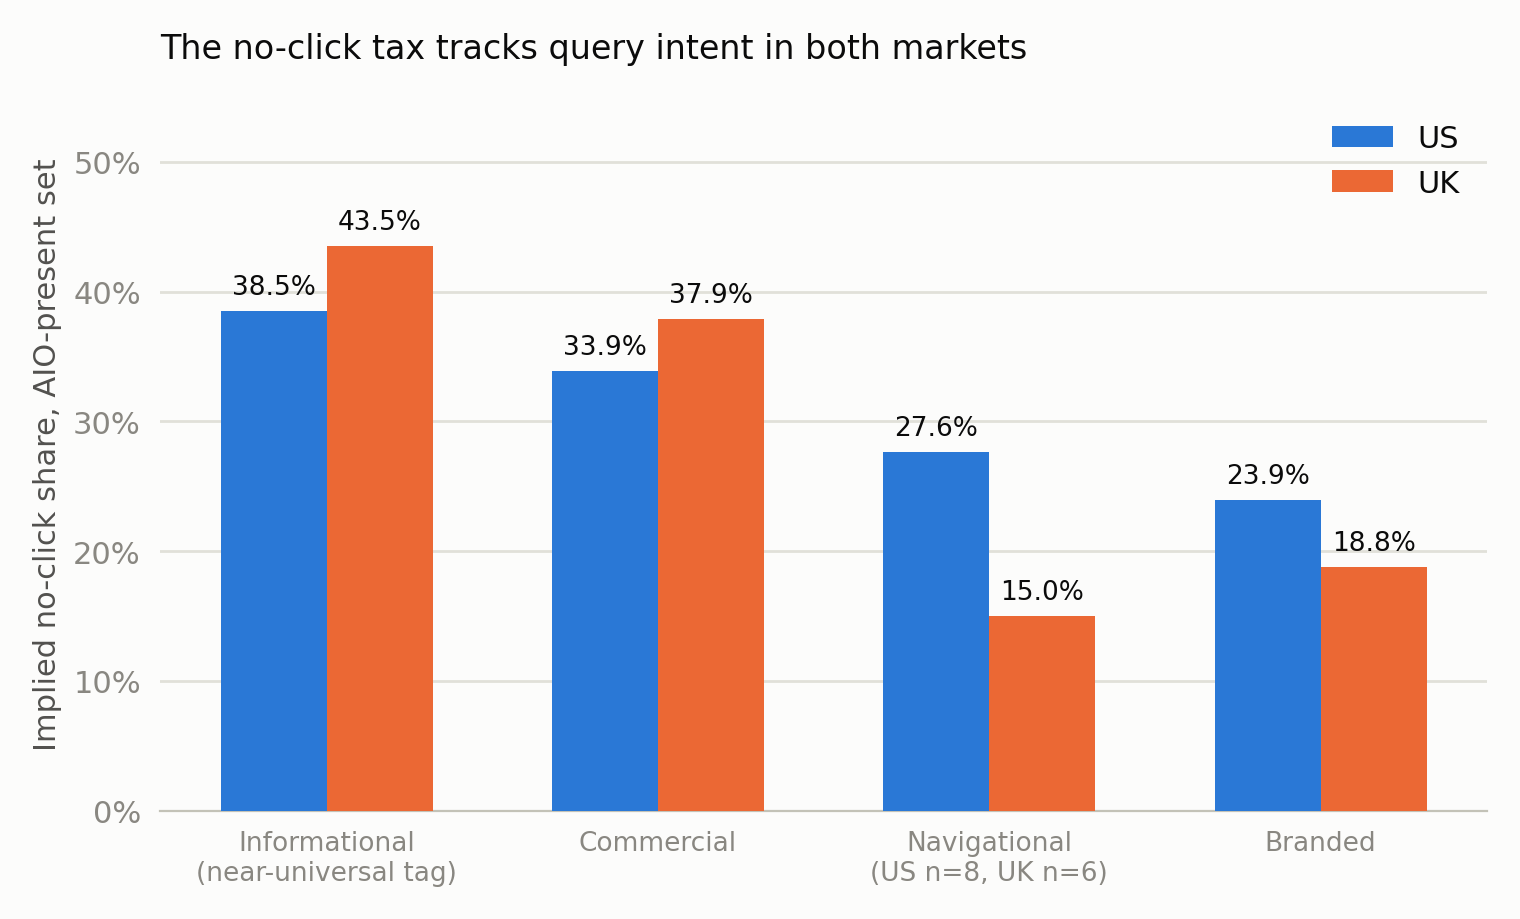
Within the AI-Overview-present set, the modeled residual is lowest for branded queries and highest across the broad, largely-overlapping "informational" tag - 24% vs. 39% in the US, 19% vs. 44% in the UK. One honest caveat up front: Ahrefs' "informational" flag applies to essentially every keyword in this dataset (100% of both the US and UK AIO-present rows carry it, including branded and commercial ones), so its rate is close to the overall AIO-present average rather than a genuinely distinct segment - a keyword can carry more than one intent flag at once. The more meaningfully distinct comparison is commercial (33.9% US / 37.9% UK), navigational (27.6% US, n=8 / 15.0% UK, n=6 - both thin samples), and branded (23.9% US, n=22 / 18.8% UK, n=11) against that broad baseline. This is a cross-sectional association across query-intent groups in this sample, not evidence that a given query's intent determines its click share.
Finding 4: The Residual Is Higher at Higher Search Volumes, Most Clearly in the US
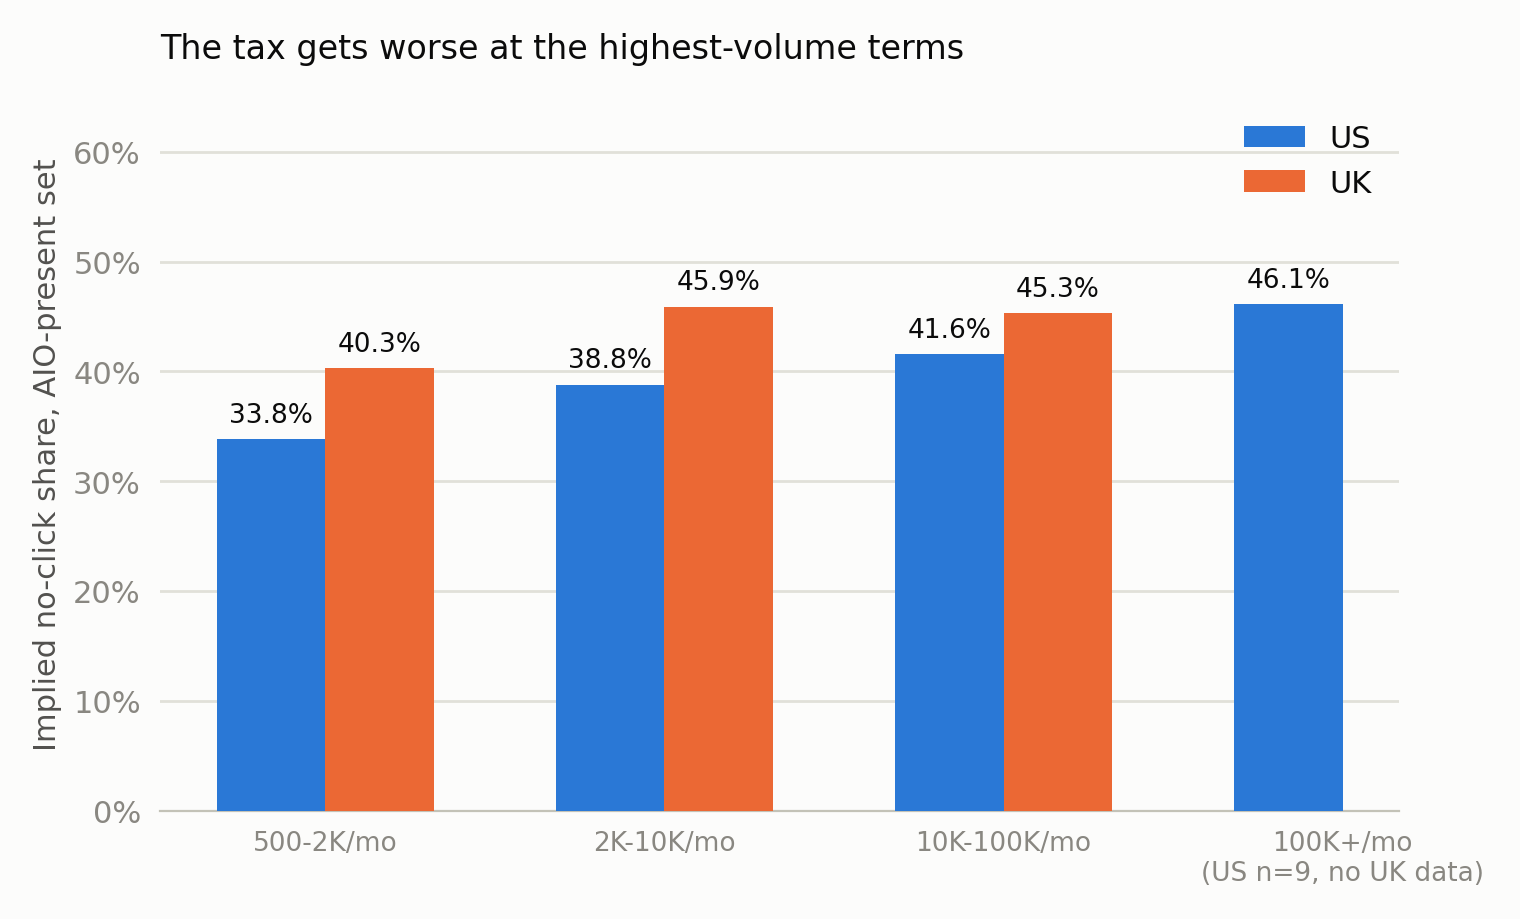
In the US AIO-present subset, the mean modeled residual increases across the reported volume bins: 33.8% at 500-2K/mo (n=61), 38.8% at 2K-10K (n=77), 41.6% at 10K-100K (n=62), 46.1% at 100K+ (n=9). In the UK subset, it rises from the first to second tier (40.3% to 45.9%, n=44/44) and then is essentially flat in the third (45.3%, n=18) - it does not rise steadily. These are descriptive cross-sectional patterns from a single August 2026 snapshot: they are not evidence that higher search volume causes a lower click share, that these are the "most competitive" terms (this dataset records search volume, not keyword difficulty), or that the pattern is changing over time. A single snapshot can't show whether mid-tail content converts better today than it did a year ago - that would need repeated observations of the same keywords, which the quarterly protocol below is designed to produce.
Finding 5: Branded Queries Show a Smaller Residual
Branded queries show a smaller modeled residual than non-branded queries in both markets in this sample: 23.9% vs. 40.2% in the US (n=22 branded, n=187 non-branded), and 18.8% vs. 46.3% in the UK (n=11 branded, n=95 non-branded) - with correspondingly higher organic-only click share on branded queries (56.6% vs. 50.6% US; 55.7% vs. 46.7% UK). The branded groups are small, especially in the UK (n=11), so treat the exact gap as directional. Paid-only click share is also higher on branded queries (15.5% vs. 4.8% US; 21.6% vs. 4.0% UK) - plausibly reflecting competitor and defensive bidding on brand terms. This is a descriptive comparison across query groups in one snapshot, not a randomized test of whether brand awareness work changes click behavior.
Finding 6: US vs. UK - a Real Gap That Narrows on a Matched Comparison
On the full samples, US AI Overview presence (83.7%) is higher than the UK (77.0%) - a 6.7-point gap. Restricting the comparison to the 109 keywords pulled identically in both markets narrows that gap to 72.5% (US) vs. 67.9% (UK), a 4.6-point difference. Because the matched subset differs from the full samples in more than just query identity - it is itself a selected group of keywords with usable data in both pulls, not the full sample with one confounder removed - this narrowing should not be read as showing what share of the full 6.7-point gap is "caused" by sample composition. Mean CPS (clicks per search, defined as clicks divided by search volume) is similar across the paired rows, US minus UK is approximately -0.01 - which supports only a narrow, descriptive statement: average modeled clicks per search look similar between markets on these particular matched keywords. It does not show the two markets behave identically once an AI Overview appears, and we would not extrapolate this gap to other market pairs without testing them directly.
Expanded Check: Who Gets Cited
Citation analysis is an exploratory purposive subsample of 50 market-query pulls (35 US, 15 UK; 40 distinct keyword strings), all with an AI Overview. The pulls skew toward much higher-volume queries than the main sample - median monthly search volume 37,000 (US) and 11,000 (UK) among the citation pulls, versus 4,850 and 2,750 across the full 500+/mo analytic sample - and were not randomly selected. The category shares below describe this citation subsample only, not citation prevalence across the broader 406-row sample or B2B SaaS search generally.
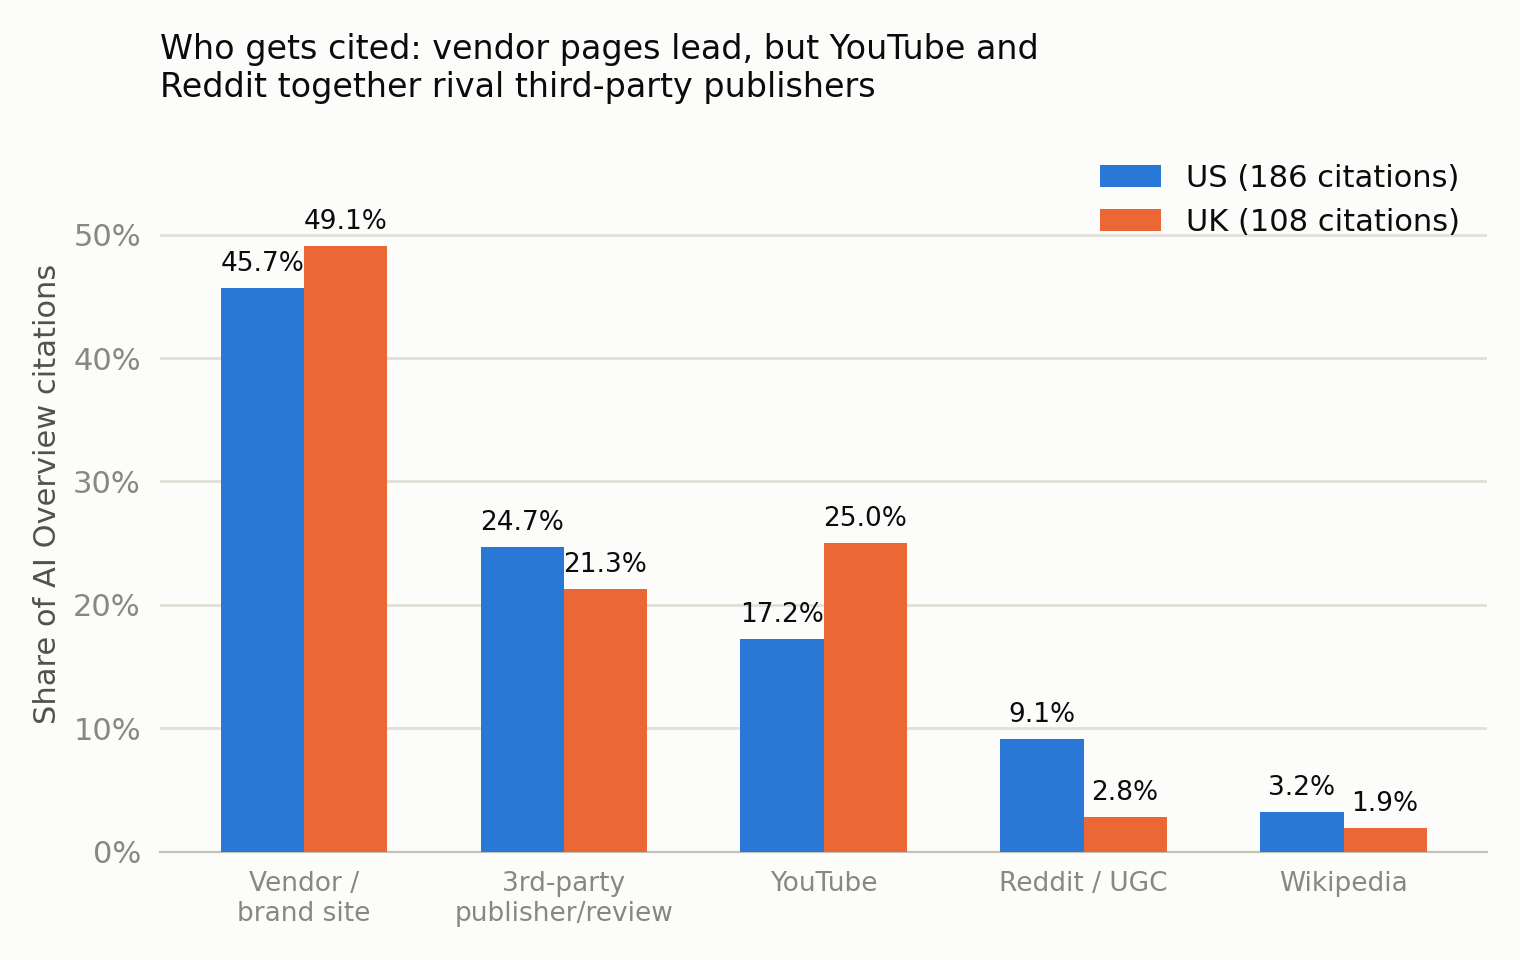
Across 294 citations from those 50 pulls, vendor and brand pages form the largest category (46.9%) - heavily via glossary/definition pages rather than product or pricing pages - while YouTube (20.1%) and Reddit (6.8%) together account for 26.9%, comparable to the entire third-party-publisher/review category (23.5%) and well ahead of Wikipedia (2.7%). Zapier's blog is disproportionately represented within that publisher category in this subsample, cited in 11 of the 50 pulls (9 distinct keywords, two of which were pulled in both markets) - more than any other non-vendor domain here. That's consistent with the hypothesis that structured "best of"/"how to" roundup content travels well into AI Overviews, though this small, high-volume-skewed subsample can't establish that on its own - treat it as worth testing, not as a proven lever.
US vs. UK Citation Mix
Splitting this subsample by market: the UK leans slightly more toward vendor sites (49.1% vs. 45.7% US) and notably more toward YouTube (25.0% vs. 17.2% US), while Reddit citations are markedly rarer in the UK (2.8% vs. 9.1% US) - consistent with Reddit's comparatively smaller footprint in UK search generally. We'd treat the UK cut with more caution than the US cut: it draws on 108 citations from 15 query pulls versus 186 citations from 35 US pulls, and both remain the same purposive, high-volume-skewed subsample described above.
High Domain Rating Among Repeatedly Cited Domains
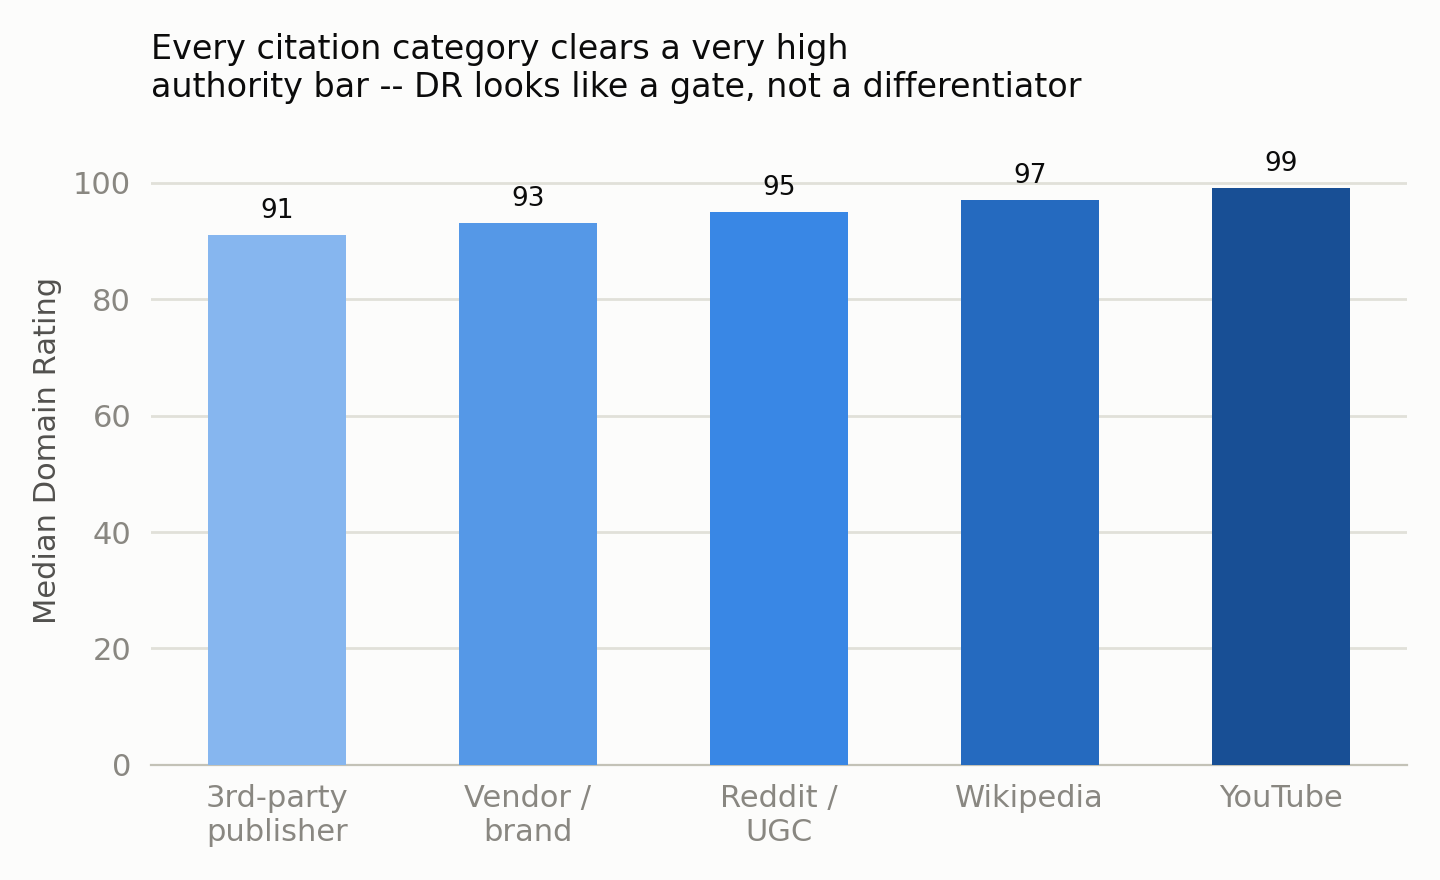
The 31 domains cited at least twice in this subsample have high Domain Rating values in Ahrefs (219 of 294 citations enriched via Ahrefs' free DR lookup), producing category medians from 91 (third-party publishers) to 99 (YouTube). Because this enrichment deliberately targeted only the frequently-cited domains - excluding the 75 singleton-citation domains and including no non-cited comparison set at all - this analysis cannot establish a DR threshold for citation eligibility, cannot show that low-DR domains are unlikely to be cited, and cannot compare the independent roles of authority and content format. It shows only that domains cited two or more times in this exploratory subsample happen to have high DR.
This is consistent with - though doesn't independently confirm - what we've found looking at the citation mechanism directly: only about 38% of AI Overview citations now come from pages in the traditional top 10 (down from 76% a year earlier), with roughly 70% of cited pages turning over within any 2-3 month window. See How AI Engines Actually Choose What to Cite for that mechanism-level analysis; this study's citation check, on its own, can't establish a causal or threshold relationship between DR, format, ranking, and citation likelihood.
What This Means for Content Strategy
The findings above describe this sample. What follows is our interpretation, downgraded to hypotheses worth testing against your own account-level data - none of it is established by this study on its own.
- Don't assume head-term content pays off on volume alone. In this sample's AIO-present US rows, the modeled residual is highest at the highest-volume tier, though the UK pattern flattens after the first tier. That's a cross-sectional association, not proof that a page's click share erodes as a term scales, or that mid-tail content converts better today than it used to - this snapshot can't show change over time. Worth testing against your own data before reallocating content budget.
- Brand equity looks like a hedge - worth testing further. Branded queries show a smaller modeled residual than non-branded queries in both markets in this sample, though the branded groups are small (n=22 US, n=11 UK). Consistent with, but not proof of, brand-awareness work helping preserve click share once an AI Overview appears.
- Glossary-style content is a hypothesis worth testing, not an established lever. Vendor pages are the largest citation category for "what is X" queries in this exploratory subsample. Worth testing whether a well-maintained glossary earns citations for your own terms - but this subsample can't establish that structure causes citation.
- The roundup-format pattern deserves testing, not scaling on faith. Zapier's outsized presence in this small, high-volume-skewed citation subsample is consistent with structured "best of"/"how to" content traveling well into AI Overviews for commercial-intent queries - treat as a hypothesis, not a proven lever.
- YouTube and Reddit are worth a second look. YouTube alone is 20.1% of citations and YouTube+Reddit approach 27% in this citation subsample. Even accounting for its high-volume skew, that's reason enough to test a deliberate presence there rather than treat UGC as out of scope by default.
- Don't assume UK content strategy is a copy-paste of US. The AIO-presence gap between markets narrows on a matched comparison, the branded-query residual looks smaller in the UK, and the citation mix leans more toward YouTube and less toward Reddit there. Together, reasons to test UK-specific tuning rather than assume US findings port over directly - though none of these differences are shown here to be caused by any specific market-level factor.
Limitations: What This Study Does Not Show
- Correlational, not causal. We cannot rule out that AI Overview presence and lower organic click share are both driven by a third factor - how "answerable" a query looks to Google - rather than the AI Overview itself causing the click loss. Independent causal evidence exists elsewhere (see "How this compares to independent research" below), but it doesn't estimate this study's B2B SaaS-specific effect size, and this study's own design can't support a causal claim on its own.
- Modeled clicks, not raw Google data. Click-distribution figures are Ahrefs' own clickstream-panel-derived model, not Google Search Console data. Treat them as directionally informative, not exact.
- Valid n differs by cut, and comparison groups are thin. The AI-Overview-presence sample is 258 US / 148 UK; the narrower click-distribution sample (non-null data only) is 248 US / 140 UK, split 209/39 present/absent in the US and 106/34 in the UK. The absent groups are small in every cut - read the present-vs-absent gaps in Finding 2 as suggestive, not statistically definitive.
- This is a single cross-sectional snapshot, not yet a time series. All data reflects one Ahrefs extraction on August 25, 2026. The export does not carry Ahrefs' own
serp_last_updatefield, so August 25 is the extraction date, not necessarily the date each SERP was observed. See the quarterly protocol below for how future releases will make genuine time-series comparison possible. - Two markets, one vertical, a selected sample. All data is US and UK, English-language, B2B SaaS/martech, drawn from five domain-mined authorities plus a hand-authored keyword list. This is a deliberate scope choice, not a claim of generality to "all B2B SaaS search" or to other industries or languages.
- The matched-pair comparison isolates query identity, not every confounder. The 109-keyword matched subset (72.5% vs. 67.9%, Finding 6) is the more defensible market comparison versus the full aggregate, but it is a selected subset of keywords with usable data in both markets - not the full sample with a single variable experimentally removed.
- Domain-mining selection bias. The domain-mined half of the sample reflects what G2, Capterra, HubSpot, Zapier, and (US-only) SaaStr already rank for in each market - not a neutral sample of "all B2B SaaS search demand."
- The citation check is a small, high-volume-skewed exploratory subsample. Its 294 citations come from just 50 query pulls (40 distinct keywords), all AIO-present and skewed toward far higher search volume than the main sample (see "Expanded check" above). Its category shares describe those 50 pulls, not citation patterns across the 406-row sample or B2B SaaS search broadly.
- Citation categorization involves judgment calls. Sorting 106 domains into vendor/publisher/UGC/reference buckets required manual classification - for example, a SaaS company's own blog counted as "vendor" even where a specific page reads like neutral third-party content, except Zapier's roundup-style posts, classified as publisher-style content given their explicit best-of/comparison format. The full domain-to-category mapping is available on request.
- Domain Rating enrichment targeted repeat-cited domains only - it cannot show a citation-eligibility threshold. Enrichment covered the 31 domains cited twice or more (219 of 294 citations); the 75 singleton-citation domains were not enriched, and no non-cited comparison domains were checked at all. That selection means the DR medians describe already-cited, repeatedly-cited domains - not a threshold that separates cited from non-cited domains.
How This Compares to Independent Research
This study is descriptive and B2B-SaaS-specific. Independent research using different methods and populations points in a similar broad direction on AI-summary click effects, but none of it validates this study's specific effect sizes, and this study doesn't validate theirs - the metrics, samples, and evidence classes differ.
| Source | Evidence class | What it can support |
|---|---|---|
| Wang, Gleason, Bart, Wilson & Metaxa (2026), arXiv:2608.18352 | Preregistered randomized field experiment, 1,100 US Chrome users | A causal click-reduction effect from AI search features generally, in a controlled US-Chrome setting - not a B2B-SaaS-specific estimate, and not this study's effect size. |
| Pew Research Center (Jul. 2025) | Observed browsing-behavior study | Lower rates of clicking outbound links when an AI summary appears - a different denominator (Google results-page visits) than this study's keyword-level residual. |
| Ahrefs (2026) CTR study | Vendor observational study | A lower position-one CTR association when AI Overviews are present - a different metric and sample than this study's modeled residual. |
Sources: Wang et al., "AI in Search Reduces Publisher Referrals Without Improving User Experience" (arXiv:2608.18352); Pew Research Center, "Do people click on links in Google AI summaries?"; Ahrefs, "AI Overviews Reduce Clicks by 34.5%".
Study at a Glance
| Metric | Value |
|---|---|
| Collected keyword-market rows (before 500/mo filter) | 435 - 269 US + 166 UK (downloadable with an included_in_analysis flag) |
| US AI-Overview-presence sample (500+/mo) | 258 - 216 present (83.7%) / 42 absent (16.3%) |
| US click-distribution sample (non-null fields only) | 248 - 209 present / 39 absent |
| UK AI-Overview-presence sample (500+/mo) | 148 - 114 present (77.0%) / 34 absent (23.0%) |
| UK click-distribution sample (non-null fields only) | 140 - 106 present / 34 absent |
| Combined analysis sample | 406 rows (presence) / 388 rows (click-distribution) |
| Matched pairs (identical keyword, both markets) | 109 keywords |
| Minimum keyword volume | 500 searches/month |
| Markets / language | United States and United Kingdom, English |
| Citation-check sample (exploratory subsample, see above) | 50 query pulls (35 US, 15 UK), 40 distinct keywords → 294 citations, 106 unique domains |
| Domain Rating enrichment coverage | 219 of 294 citations (74.5%), 31 repeat-cited domains only |
| Data pulled | August 25, 2026 (single snapshot) |
Download the Data
The underlying dataset is available as four CSVs, released alongside this study. Note on this revision: a fifth, pre-filtered 406-row analysis file is planned for a future update and is not yet available - the four files below are unchanged.
- Combined keyword-level dataset - 435 collected US/UK keyword-market rows with an
included_in_analysisflag, volume, AI Overview presence, intent flags, and click-distribution percentages. - Matched-pair keyword subset - the 109 identical keywords pulled in both markets, used for Finding 6's like-for-like comparison.
- Citation-level data - all 294 AI Overview citations, each with its keyword, market, domain, category, and Domain Rating where enriched.
- Domain-to-category mapping - the 106 unique cited domains, aggregated with total citation counts and Domain Rating.
Quarterly Update Protocol
This is the first snapshot, not yet a time series. Making it one requires more than "rerun the same methodology" - Ahrefs can revise volumes, clickstream models, and intent labels between pulls, and the domain-mined portion of the sample can gain or lose rows as rankings change. Future quarterly releases will follow this protocol:
- Freeze the current panel. Every market-keyword row and its August 2026 values are retained as a fixed panel - never silently replaced by newly mined keywords.
- Rerun the fixed panel first. Report paired changes only for rows with valid observations in both periods; disclose attrition, nulls, and changed SERP-observation timestamps.
- Keep discovery separate. A refreshed domain-mined/discovery sample may be published separately to describe the current landscape, but will not be blended into the longitudinal trend line.
- Reserve a fixed citation anchor panel. A permanent subset of the current 50 citation pulls will be trended over time; any additional pulls will be published as a clearly labeled rotating exploratory set.
- Version the files and methods. Each release will publish a codebook, the inclusion flag, an extraction timestamp, Ahrefs'
serp_last_updatewhere available, the analysis method, and a change log for any Ahrefs field or definition changes. - No zero-filling. Missing values are never backfilled with zero; the valid n for every mean, rate, bin, intent cut, and market cut is published alongside the figure - as it is throughout this piece.
Cite This Research
Zivkovic, Z. (2026). The AI Overview Click Tax in B2B SaaS Search: An Ahrefs-Modeled US/UK Snapshot. CoreAEX. Data pulled August 25, 2026; revised August 26, 2026.
This snapshot will be followed by fixed-panel quarterly releases (see the Quarterly Update Protocol above) starting October 2026 - check coreaex.com for the current release, and cite the specific dataset version, before using a number in a time-sensitive context.
Appendix: Sourcing Detail
Domain-mined sources: g2.com, capterra.com, hubspot.com, zapier.com, saastr.com - pulled via Ahrefs Keywords Explorer, target_position = top 10, US and UK markets, filtered to volume 500+/mo and non-branded intent, then passed through the relevance vocabulary filter described in Methodology. saastr.com returned no UK rows meeting these combined filters - which describes this study's filters, not SaaStr's overall content footprint.
Curated seed categories: CRM, marketing automation, account-based marketing, customer data platforms, sales engagement/enablement, lead generation & scoring, email marketing, SEO tools, content marketing, demand generation, intent data & enrichment, RevOps, marketing attribution & analytics, chatbots/conversational marketing, customer success, sales intelligence & prospecting, webinar software, landing pages, CRO/A-B testing, social media management, project management (adjacent), HR tech (adjacent), helpdesk/customer support, no-code/workflow automation. Pulled identically for both the US and UK markets.
About the author
Zarko Zivkovic is the founder of CoreAEX, building technical SEO, AEO, and AI-visibility systems for B2B SaaS companies. Connect on LinkedIn.